Streaks in the US equity market
In this note we'll look into streaks – periods of uninterrupted price increases and decreases, a.k.a. bull and bear markets– in the US equity market.
We use data from Kenneth French's website at https://mba.tuck.dartmouth.edu/pages/faculty/ken.french/ The dataset comprises daily data total-return data.
library("NMOF")
library("zoo")
P <- French(dest.dir = tempdir(),
            dataset = "market",
            frequency = "daily",
            price.series = TRUE,
            na.rm = TRUE)

P <- zoo(P, as.Date(row.names(P)))
str(P)
‘zoo’ series from 1926-06-30 to 2020-11-30
  Data: num [1:24875, 1] 1 1 1.01 1.01 1.01 ...
 - attr(*, "dimnames")=List of 2
  ..$ : chr [1:24875] "1926-06-30" "1926-07-01" "1926-07-02" ...
  ..$ : chr "Market"
  Index:  Date[1:24875], format: "1926-06-30" "1926-07-01" ...
The data are complete: there are no missing values.
any(is.na(P))
[1] FALSE
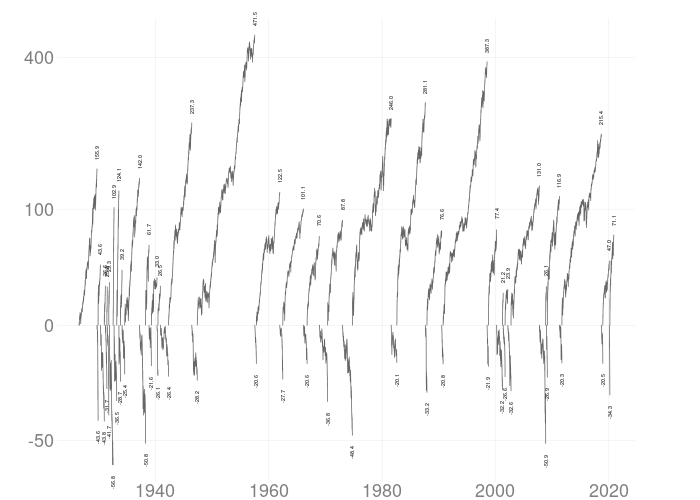
Function `streaks` in package PMwR computes series of uninterrupted up and down movements ('streaks') in a price series. Uninterrupted is meant in the sense that no countermovement of a certain percentage size or more occurs in up (down) movements. Th default is threshold is 20%.
library("PMwR")
up.down <- streaks(P)
str(up.down)
head(up.down)
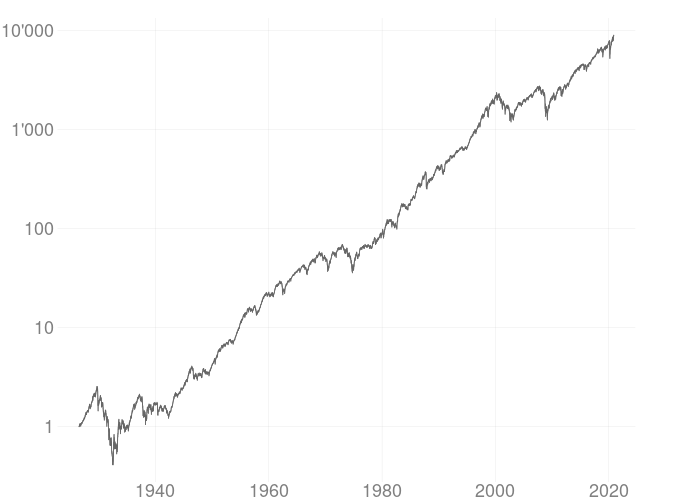
We can plot those streaks.
library("plotseries")
par(cex.axis = 2)
plotseries(P, log.scale = TRUE)
par(cex.axis = 2)
plotseries(P, series.type = "streaks")